
Practice question
Question
Which curve best fits ground squirrels?
Explanation
Ground squirrels are commonly represented by a Type II survivorship curve because their probability of dying is treated as approximately constant across much of life. On a semilogarithmic survivorship graph, a constant hazard produces a roughly straight decline. Real populations can depart from this ideal when juveniles, dispersers, or old individuals experience different risks, so the classification is a broad empirical approximation. A survivorship curve is built from a cohort life table by plotting the proportion alive at each age. Type I concentrates mortality late, Type II approximates a constant hazard, and Type III concentrates mortality early. These are descriptive models, so a species may shift between them when predators, care, climate, or habitat quality changes. The example should therefore be understood as an application of a general model, with its assumptions kept explicit. Ecological predictions remain conditional on the stated environment, because changing resources, mortality, or interactions can alter the observed demographic pattern.
Related blogs
Guides and insights connected to this topic

SARS-CoV-2 Coronavirus: Structure, Genome, Proteins, Replication, Pathogenesis, and Host Interaction
Coronavirus Overview Coronaviruses (CoVs) are enveloped viruses (surrounded by a lipid membrane derived from host cells), belonging to the s...

Coronavirus Structure, Genome, Replication, Symptoms, Pathogenesis, and Prevention
Structure of Coronavirus Coronaviruses (enveloped RNA viruses) fall in the virus family Coronaviridae, order Nidovirales. They are enveloped...
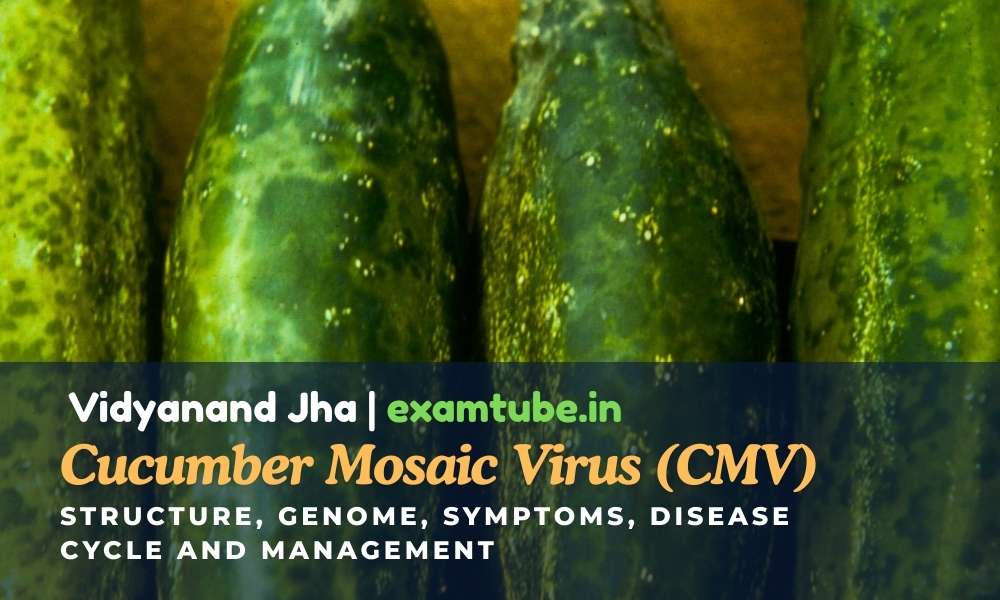
Cucumber Mosaic Virus (CMV): Structure, Genome, Symptoms, Disease Cycle and Management
Cucumber Mosaic Virus (CMV): Introduction and Importance Cucumber Mosaic Virus (CMV) (plant-infecting RNA virus) is one of the most economic...