
Practice question
Question
The x-axis and y-axis in phase-plane diagram usually represent:
Explanation
“Density of species 1 and species 2” for the x-axis and y-axis in phase-plane diagram usually represent. This relationship follows from the ecological mechanism represented by the terms in the item, not merely from an association between their names. Species interactions are classified by their net effects on the fitness of each participant, but those effects can change with density, resource supply, life stage, and environmental stress. Competition reduces access to shared limiting factors, whereas predation and parasitism transfer resources from victim to consumer. The remaining alternatives—“Time and density”, “Carrying capacity”, “Resource availability”—refer to different states, processes, or scales and therefore do not express the same causal relationship. Coexistence requires stabilizing differences that make each species limit itself more strongly than it limits its competitor, or an equalizing process that keeps fitness differences small. Without such mechanisms, persistent competitive asymmetry tends toward exclusion. Linking the wording to measurable consequences for fitness, abundance, or flux gives the conclusion its scientific meaning and prevents a purely mnemonic interpretation.
Related blogs
Guides and insights connected to this topic

SARS-CoV-2 Coronavirus: Structure, Genome, Proteins, Replication, Pathogenesis, and Host Interaction
Coronavirus Overview Coronaviruses (CoVs) are enveloped viruses (surrounded by a lipid membrane derived from host cells), belonging to the s...

Coronavirus Structure, Genome, Replication, Symptoms, Pathogenesis, and Prevention
Structure of Coronavirus Coronaviruses (enveloped RNA viruses) fall in the virus family Coronaviridae, order Nidovirales. They are enveloped...
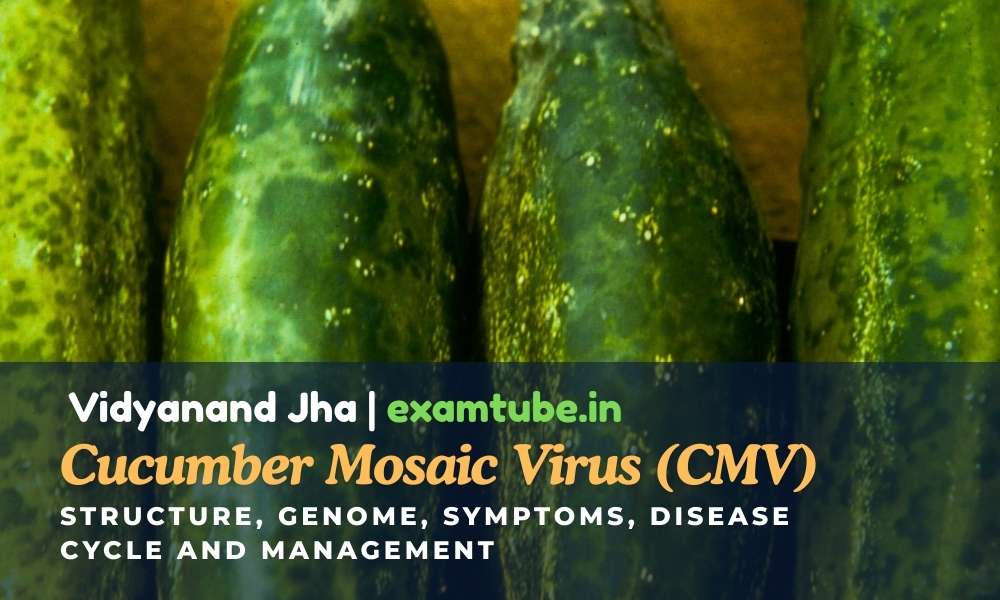
Cucumber Mosaic Virus (CMV): Structure, Genome, Symptoms, Disease Cycle and Management
Cucumber Mosaic Virus (CMV): Introduction and Importance Cucumber Mosaic Virus (CMV) (plant-infecting RNA virus) is one of the most economic...