
Practice question
Question
Growth-survival-fecundity triangle helps to classify:
Explanation
“Plant life-history” for growth-survival-fecundity triangle helps to classify. This relationship follows from the ecological mechanism represented by the terms in the item, not merely from an association between their names. Survivorship curves summarize age-specific mortality: Type I concentrates loss late in life, Type II approximates a constant hazard, and Type III concentrates loss early. They are empirical patterns, not rigid taxonomic rules. The remaining alternatives—“Carnivores”, “Bird migration”, “Keystone species”—refer to different states, processes, or scales and therefore do not express the same causal relationship. Selection favors the schedule that increases lifetime reproductive success under local mortality and resource conditions. Body size, development time, fecundity, parental investment, and generation length consequently tend to covary. This distinction matters because similar surface patterns can arise through different mechanisms, whereas ecological prediction depends on identifying the mechanism that actually changes rates. The cited framing is therefore most useful when treated as a conditional biological claim, with assumptions about scale and environmental context kept explicit.
Related blogs
Guides and insights connected to this topic

SARS-CoV-2 Coronavirus: Structure, Genome, Proteins, Replication, Pathogenesis, and Host Interaction
Coronavirus Overview Coronaviruses (CoVs) are enveloped viruses (surrounded by a lipid membrane derived from host cells), belonging to the s...

Coronavirus Structure, Genome, Replication, Symptoms, Pathogenesis, and Prevention
Structure of Coronavirus Coronaviruses (enveloped RNA viruses) fall in the virus family Coronaviridae, order Nidovirales. They are enveloped...
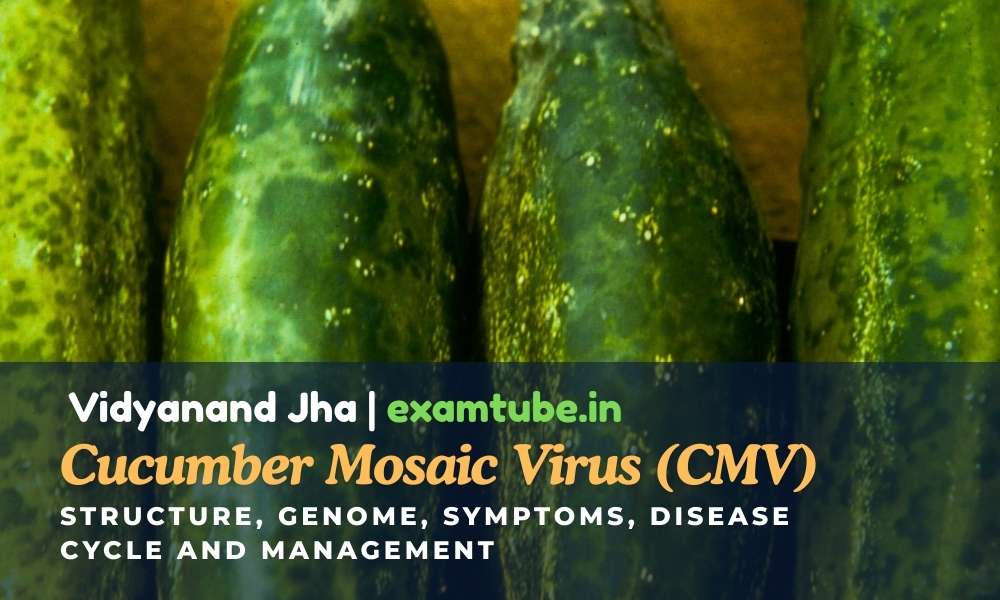
Cucumber Mosaic Virus (CMV): Structure, Genome, Symptoms, Disease Cycle and Management
Cucumber Mosaic Virus (CMV): Introduction and Importance Cucumber Mosaic Virus (CMV) (plant-infecting RNA virus) is one of the most economic...